Basics of Sound
This unit will be focusing on utilizing the Tone.js library to crate programs that can playback audio and generate its own synthesized sounds in real time. The purpose of this page will be to act as a basic introduction to the physical properties of sound and the processes needed for digital audio. Some of these ideas are explored in the lessons to come, but this page contains more detailed information for each topic needed to have a core understanding of the concepts of sound. This page is not necessary to complete the chapter, but provides extra knowledge that could prove helpful for understanding the concepts we are about to explore.
Sound Waves
Sound travels in the form of vibrational waves through different materials. The speed at which these waves travel depends on the specific material that the vibrations are traveling through. Below are several materials and the speed that sound will travel through them.
| Material | Speed (meters/second) |
|---|---|
| Air | 331 |
| Water | 1496 |
| Aluminum | 6420 |
| Steel | 5940 |
| Muscle | 1580 |
| Copper | 6420 |
| Space | 0 |
Notice how sound waves travel faster through denser materials. For the purposes of this course, we will be using the speed of sound in air: 331 m/s whenever we refer to the “speed of sound”.
In order to crate these waves something needs to create vibrations. This something could be an instrument, a voice, a speaker, or anything else. These vibrations cause the molecules in the air (or other medium) to vibrate as well; these molecules will then push into the ones next to them before moving back into their original position. When the molecules are close together the sound medium’s density increases as shown in the image below:
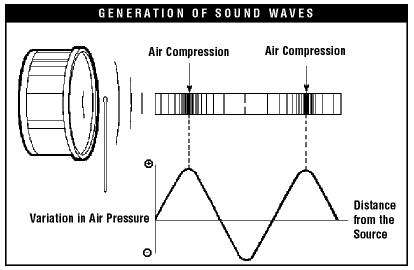
Notice the waveform on the bottom of the image. When the air is at its most compressed, the waveform’s positive peak is at its highest, and when the air molecules are the least dense, the graph has its largest negative value. Waveform diagrams are an important tool when discussing properties of sound and will help us to visualize the various elements that make up a tone.
Properties of Sound
This next section discusses what goes into the sounds we hear and how humans perceive different qualities of sound.
Frequency
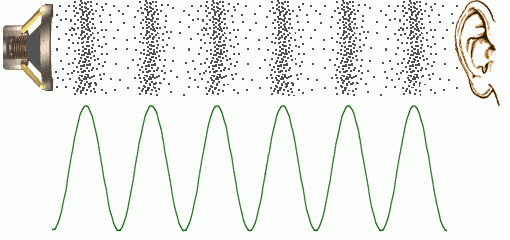
Lets look at the waveform diagram below. We can see that there are a series of waves that are traveling from a source to our ear.
The number of times per second, ot frequency, that a sound passes a human ear or a recording device is what determines its pitch. Generally speaking, humans can hear sounds that fall between 20-20,000 Hertz(Hz). Hertz is a unit of measurement meaning times per second. In actuality, each person’s individual hearing range is slightly different baed on their age, hearing loss, and many other factors. Below is a video that can be used to determine your approximate range of hearing. Keep in mind that listening on small speakers may affect the sounds being output.
Perceived pitch
When you were listening to the video did it seem like there were pitches that repeated themselves? If not, take another listen. If you are still having trouble hearing it, lets look at a piano.
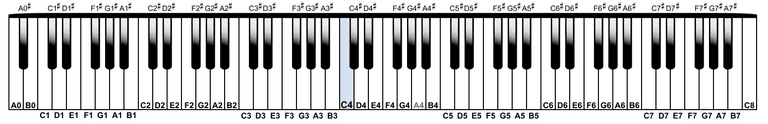
The keys on the piano are arranged in a repeating pattern. If you play the note D2, followed by the note D3, they will both sound like a ’D’ however humans will perceive one as being higher. Why is that?
This is because as we move up the keyboard, and up in pitch, the frequency of the notes being played is increasing. These numbers increase exponentially as notes become higher. for every octave you move up on the keyboard, the frequency doubles. If A4 = 440Hz, then A5 = 880Hz, A6 = 1760Hz, and A2 = 110Hz. This relationship is true for all sounds, not just the notes that are playable on a keyboard.
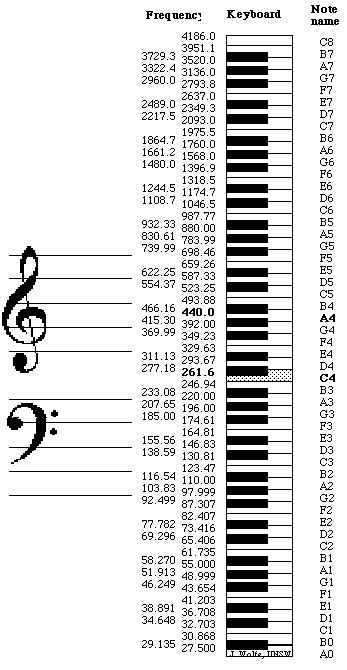
You can see this relationship between frequency and pitch a little more clearly in this image.
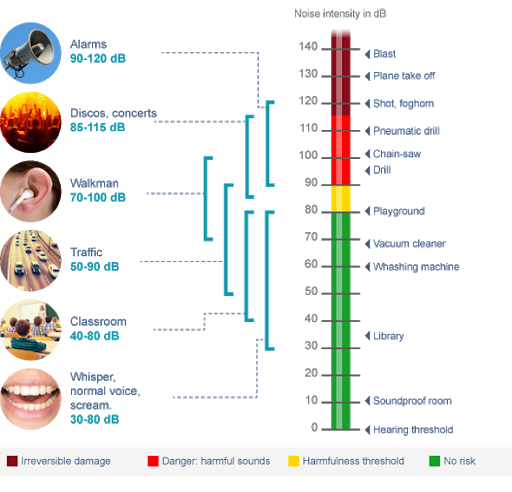
Volume
Lets think back to the video we saw earlier on this page. When you listened to it there were a few parts where the volume seemed to change. The sound would have faded in and out, and dipped a little in volume approximately 2⁄3 of the way through what you could hear. This is because humans are more sensitive to sounds at certain frequencies than others. If we look at the chart below we can see the areas that people are able to hear the strongest.

The Y-axis of this chart is the volume that the sound is perceived at, and the X-axis is the frequency. Again, this is a general guide and the actual responses can vary from person to person based on multiple factors. Bu tbe sure to keep this in mind when choosing pitches for your synthesizers.
Amplitude
But what is causing the sound to have volume and how can we change it? Lets look at this image again and talk about some pore parts of a waveform.
We have already discussed the frequency of the sound wave, how many peaks/valleys pass our ears per second, but what about how large those waves happen to be? This aspect of a sound wave is called its amplitude and is one of the factors that determine how loud a sound is. (In combination with several other factors, one of which we have already outlined above.) Simply put, the more energy put into a wave, the more molecules will be displaced, and the louder the sound will seem. The amount of compression in a waveform is represented on its vertical axis, so the larger the peaks of a sound, the louder we will hear it as. We can measure this level of power in Watts (W). Like frequency, these values increase exponentially. Humans can hear an incredibly wide range of Watts, approximately 10^-18 W up to 10^-2 W when most people begin to experience pain from loud volumes. In order to make this range more manageable, we use a logarithmic scale measured in decibels SPL. The SPL stands for sound pressure level; many times this is just abbreviated to decibels, or dB. When you increase the dB level of a sound by 10, it will effectively double its perceived loudness. The graph below helps to illustrate this.
Human Hearing
Now that we know about the different aspects of sounds and how humans perceive them, lets talk briefly about why that is.
When sound waves travel through the air, the outside of our ears, called the Pinna, work to help funnel the vibrations into the inside of our heads. It is here that a series of small movements take place that allow us to perceive sound.
These vibrations travel through the ear canal until they reach our eardrum. This is a thin membrane that absorbs the air vibrations and transfers them to a series of small bones in the middle hear.
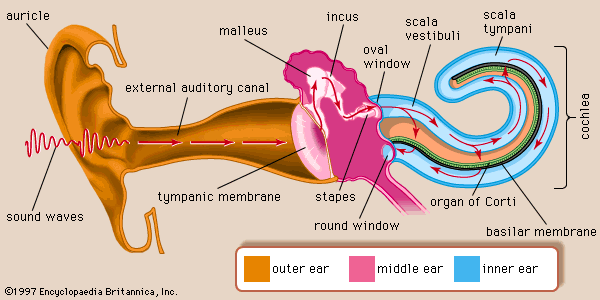
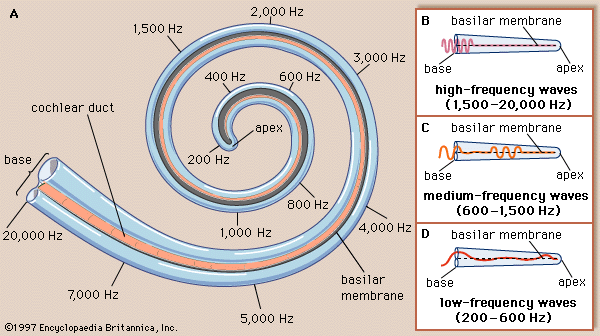
These three bones vibrate in a specific motion when sound waves finally each them. This motion helps to channel the vibrations into the inner ear’s cochlea. This small organ contains contains many hair like receivers suspended in fluid along its length. Different frequencies will cause different areas of receivers to be activated. THis activation stimulates nerves which communicate to the brain the different characteristics of the sound. sounds with a larger amplitude will cause the receivers to be more strongly stimulated. The image below shows what areas of the cochlea respond to different frequencies. This organ is curled up on itself both to help contain it, and alow for a better response to lower frequencies. This is why humans can hear lower sounds better than higher ones.
Digital Sound Recording
Generally we have discussed how we can hear a sound, but how do we record it into a sound file that we can use on our computers? This process is surprisingly straightforward, even if it requires a relatively large amount of computer power to achieve.
To record sound we first need two things: a sound to record, and a microphone. We will need a few more things down the line but lets start here.
Microphones
The sound will be happening and travelling through the air as we have already discussed, and our microphone will be acting like mechanical ear to collect the sound vibrations. There are multiple kinds of microphones that all function slightly differently and have different uses. Some of the more common general types are Dynamic, Condenser, and Ribbon. there are several other kinds, but lets just talk about these three to get a general understanding of how they work.
Before we get into the unique aspects of each microphone, lets talk about how they are all similar. Each microphone takes the incoming changes in air pressure and transforms them into an electrical current. This current mimics the sound waves in several ways: Louder sounds crate larger voltages in the electrical current, and the frequency is represented in how often the voltages increase and decrease, just like in a waveform diagram. This electrical signal is then sent out of the microphone’s cable into the device that will be recording it.
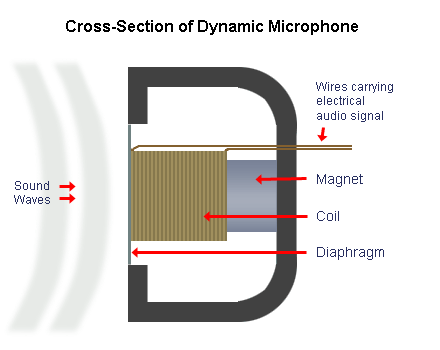
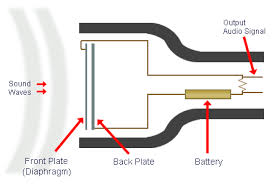
Dynamic Microphones
Dynamic microphones are often the most inexpensive and most sturdy microphones used to record various audio. Inside of their head is a thin wire coil that is wrapped around a magnet. The air waves push the coil around the magnet which generates the electric current. This mechanism is identical, but opposite, to how loudspeakers work.
Condenser Microphones
A condenser mic functions a little differently and can be a little more fragile than a dynamic microphone. These microphones contain a thin metallic membrane that is located lose to a metallic plate. This plate is hooked into a small capacitor which can take in and send out electrical current. As the sound waves move closer together, causing the space between them to condense, an electrical current is made which is sent through the capacitor and out the microphone cable. These microphones require a constant supply of electrical current in order to work. Many modern recording devices are able to supply this phantom power directly through the microphone cable.
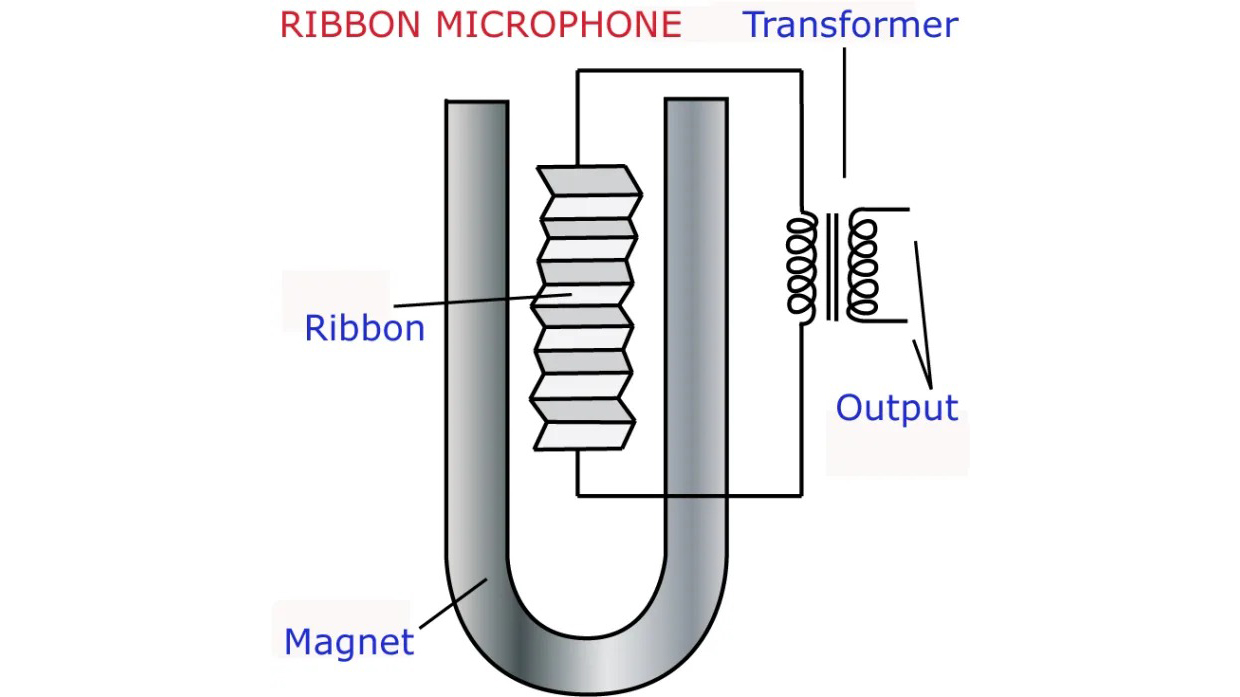
Ribbon Microphones
Ribbon microphones are perhaps the most fragile microphones, and function similarly to the human ear. Inside of the large capsule is a thin metallic ribbon suspended within a magnet. The vibrations coming into the microphone cause different parts of the ribbon to vibrate, which causes different the different frequencies to be sent out of the microphone cable. ribbon microphones also contain a transformer to increase the output voltage to be strong enough for the other electronics to work with. In many older ribbon mics the ribbon was extremely delicate and could be destroyed by large amounts of air pressure, or burnt out if too much electrical current (such as phantom power) was passed through the system. This caused many older ribbon microphones to be extremely expensive. Modern ribbon microphones are a little more robust and a few even require phantom power in order to function, however they can still be some of the more expensive microphones on the market.
Recording the signal
Once the electrical signal has left the microphone the recording device must decide what to do with it. In computer audio, this process falls to the Analog-to-Digital converter (ADC). A piece of hardware that looks at the incoming electrical signal and converts it into a format that the computer can understand and store. When recording, the ADC will take a ‘snapshot’ of the incoming voltage at a regular interval and store the level of the electricity coming in as a value. The computer then stores all of these values together and saves them as a sound file that can be played back on demand or altered through various software algorithms.
Sample rate
The ADC’s sample rate is the number of times per second that the computer looks at the audio and records its level. The general standard for audio recordings is 44,100 times per second. some higher definition recordings such as ones made for films can have higher rates such as 48 kHz or 96kHz, but these result in much larger audio files. Because this process is happening so many times per second, recording and processing audio can take up a large percentage of the computer’s processing power.
If we were to place all of these samples on a graph and connect them like a waveform, our recording would look like this:
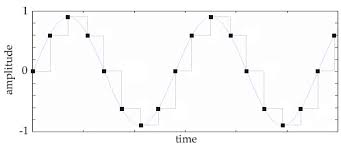
Because the digital file is comprised of a series of snapshots there is a jagged appearance to the waveform. This is why higher definition sound recordings contain more samples. As the sample rate decreases, more of the original audio is removed from the recording.
Bit Depth
A recording’s bit depth is closely related to its sample rate. Every time the computer takes a sample it is storing the level of the electricity at that instance as teh closest bit level to be played back later. The bit acts like the resolution of the sound. As there are more bits, the computer is able to make a more accurate representation of the incoming audio signal.
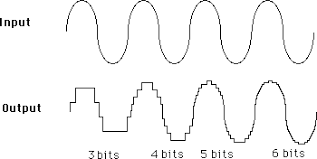
The standard bit depth for CD recordings is 16. Higher definition recordings could be as high as 24 or 48, but like with the sample rate, these increase the file size and CPU usage when processing.
Audio Pathways
At this point we have now gone through what happens when we record an audio source with a computer and save it as a file. These files such as .wav and .mp3 contain different information from the recording process are can be processed in different ways. Most programs can handle the majority of audio files for the purposes of this class, .mp3 files are recommended because of their smaller file size.
Once the audio has been recorded we can either play it back directly from the computer, or we can apply various computer algorithms to it. these algorithms alter the numbers stored in the audio file based on certain parameter in order to change the sound that we will ultimately hear. We can chain these audio effects together by sending the numbers in the file through the various processes as a continual stream from A to B to C etc. We will discuss this in more detail in this unit, but think of the audio pathway as a directed steam that we can send the audio through. We can change how this stream flows at will in order to form our audio however we want.
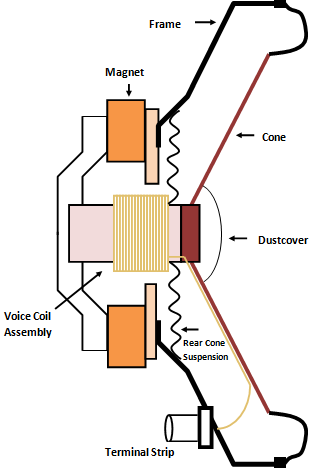
At the end of the digital pathway is the Digital-to-Analog converter (DAC). This device does the exact oppilate of the ADC: takes in sample values and converts them into an electrical signal. This signal then travels to the speakers and ultimately to a thin wire wrapped around a magnet. The magnet (or wire, it varies based on the manufacturer) is then moved back and forth based on the varying electrical current. One end of the magnet is connected to a thin membrane, and the vibrations push the air as the magnet/coil move. The resultant sound waves then travel through the air for us to hear them as we have already discussed.
Try playing a sound file through your computer via spottily, iTunes, YouTube, or a similar application. Start with your device volume low and lightly place your fingers on the speakers. Gradually turn the volume up to the maximum. Could you feel the vibrations causes by the moving coil and membrane?
Below is a video showing these vibrations in case you were unable to feel them.
Sound Synthesis
The final concept to discuss on this page is sound synthesis. We have already gone over how a computer can store values from a recording as a sound file and play them back. Using this as a base the computer can generate its own audio tones that did not come from a previously recorded source. The computer can generate values that can then be sent to the DAC in order to generate sound. Below is a video showing a graphical representation of each waveform, and an audio example of them, as well as a little more information on oncillators.
Sine
Sine waves have a gradual, curved slope between their high and low pressure levels. These sounds are considered to be ‘pure’.
Square
Square waves jump immediately from high to low with no slope. These waves act like a boolean varible, because they only have two states.
Triangle
Triangle waves move linearly from their high to low pressure levels with no curves. It sounds a little brighter than a sine wave.
Sawtooth
A Sawtooth moves linearly from low to high, and then immediately jumps back to low. The ratio between these events can be changed to alter the sound of the wave.
Additive Synthesis
The concept of additive synthesis is that we can generate complex tones by combining multiple copies of these waveforms are various frequencies. The mathematical relationship between the frequencies used can determine the quality of the sound being produced. Generally frequencies that are whole number multiples of each other tend to be more consonant, where as other intervals are more dissonant.
Subtractive synthesis
tones can also be generated by removing sounds from a source. Noise tends to be made up of multiple frequencies randomly spread out across the human hearing range. By systematically removing certain frequencies with audio filters, we can chisel out the sound that we want. Examples of both of these kinds of synthesis will be further explored in the unit.
ADSR
When the computer is generating these sounds, the sound will exist forever unless we apply an amplitude envelope to the sound. This envelope acts as a set of constraints for the sounds volumes, giving it a certain space to fill before going away. Each envelope has four main parts:
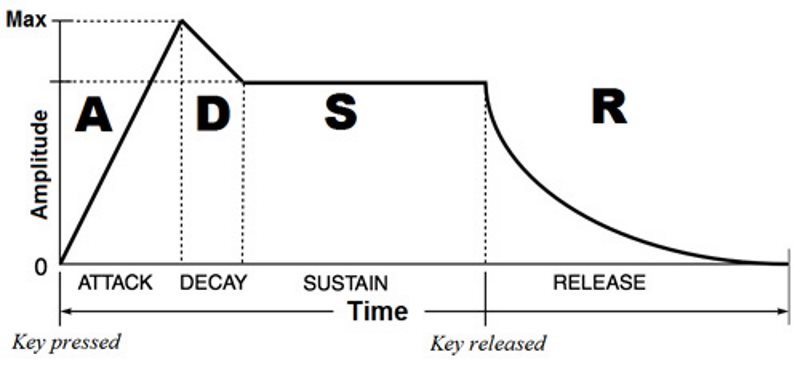
Attack
The entrance of the sound where the volume increases from nothing.
Decay
A slight decrease in volume from the attack before the main part of the note.
Sustain
The body of the note. The sound will remain in this state for as long as the note is held for.
Release
The final fading of the sounds volume back to silence.
By altering the times that each of the four envelope sections take, as well as their shape (linear vs exponential) we can vastly alter the sound of the notes being played through a synthesizer. The possibilities are almost endless.
Now that we have an understanding of the various sound concepts that we will go over in this unit, lets move on to the next main chapter; where our goal is to use P5 to trigger the playback of various sound files.