Coordinates and the Canvas
The canvas in p5 is the area that you can see on your screen, and is displayed in the preview window to the right of the code editor. This canvas acts much like a painting canvas in the following ways:
- Whatever you want the viewer to see must be on the canvas.
- You can cover up something on the canvas by adding something new on top of the original object.
- The canvas can come in many colors and sizes There is a definitive top and bottom for the canvas.
Look at the default starting code in p5, you can see a few items that are used to set up the canvas.
Inside of function setup(), you can see the line createCanvas(400, 400); this line is what tell p5 to create the canvas, and how large to make it. The numbers represent how wide and tall to make the canvas from the top-left corner, in pixels. The default is 400px x 400px. Try adjusting these numbers to see how the canvas changes.
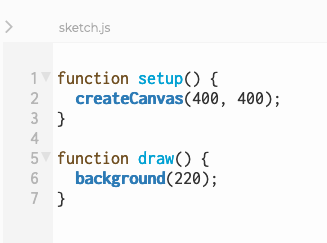
This is the default P5 starting code. All it does is make the canvas and give it a background color. Everything else is up to you!
Inside of function draw(), you can see the line background(200); this line is what determines the color of the canvas. We will discuss color in more detail in a later chapter, but know that the number represents the grayscale shade of the canvas. 0 = completely black, and 255 is completely white. (number higher than 255 will not affect the color and will will just read as 255 when the code is executed)
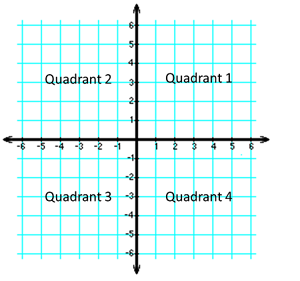
As previously mentioned, the canvas is arranged in pixels, similar to a coordinate plane in geometry. What is important to know is that the point 0, 0 is the TOP LEFT corner of the canvas, like quadrant 4 of a coordinate plane.
Try adding the lines below inside of the draw function (after background(220), but before the closing brace })
console.log(mouseX, mouseY);
This line will show us the current pixel coordinate of the mouse in the p5 canvas on the bottom of the screen. Notice how moving the mouse changes the numbers. We can use these numbers to tell out code where to put different objects on the canvas.
As shown in the code below, by increasing the X coordinate of various items on the canvas, that object will move to the right. Increasing the Y coordinate will lower the item on the canvas. The inverse of this is also true.
See the Pen Example Code by LSU DDEM ( @lsuddem) on CodePen.
https://codepen.io/lsuddem/pen/pojzjoXIn the next code, the same functionality from the previous code is present, but now when you click the mouse, a bulls-eye pattern will appear at the mouse’s location. The XY pixel coordinate of this shape is also displayed. Try clicking in various places to see how the location numbers change.
See the Pen Example Code by LSU DDEM ( @lsuddem) on CodePen.
https://codepen.io/lsuddem/pen/xxwKwgqLETS PRACTICE!: Drawing basic shapes on the canvas:
Below are a few basic shape functions that we will expand on later. All shape functions need a set of coordinates in order to be drawn on the screen.
- line(X1, Y1, X2, Y2);
- line() draws a straight line between the two coordinate points given as arguments.
- ellipse(X location of center, Y location of center, width of shape, [height of shape])
- An ellipse is a circle or oval. By default, an ellipse is drawn out from the center point. (note, the height of the shape is not required to draw an ellipse, but p5 will assume that it will be a perfect circle unless you give it a specific height)
- rect(X of top left, Y of top left, width of shape, [height of shape])
- Rectangles are drawn similarly to the canvas: starting at the top left, and then out by a specified width and height. Having the last two arguments be identical will result in a perfect square.
- triangle(X1, Y1, X2, Y2, X3, Y3)
- Triangle can be a little difficult. Each pair of numbers is the XY pixel location of a point of the triangle. To move the shape, you will have to move each point individually, and may have to do a little math in order to make everything line up properly.
For more information on the shape functions, look at the chapter “Basic and Advanced Shapes”
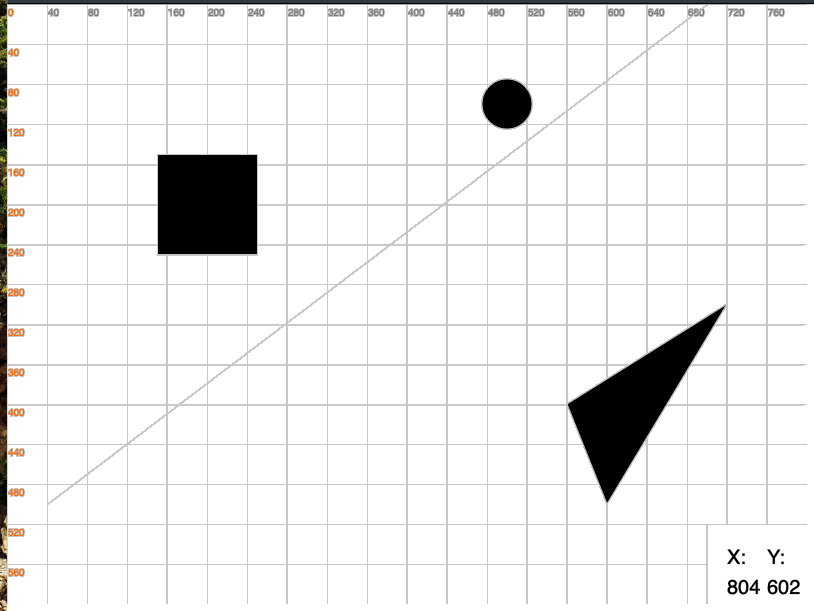
Use what we have learned so far in order to recreate the following image using the image and code below as a guide line:
See the Pen Example Code by LSU DDEM ( @lsuddem) on CodePen.
https://codepen.io/lsuddem/pen/pojzjoX